Geodata Service
|
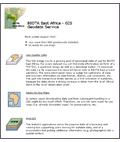
The online geodata service provides a shared data pool of geo-spatial datasets covering the BIOTA East Africa investigation areas. It was implemented to support the interdisciplinary integration of the various research subprojects and splits into three sections:
The geodata catalogue includes more than 500 geodatasets. It is divided into nine hierarchical levels and different thematic sections. For every dataset there is a meta description, a quicklook image, and a download button. 55 thematic ready-to-use maps are available in jpg/eps formats and can directly be used in presentations etc. In edition you will find some basic WebGIS applications.
|
The following tools and applications have been developed to support biodiversity monitoring and forest management particularly in the Kakamega-Nandi forests:
WebGIS

|
Visualisation tool for an integrated geodata and text study
The tool for an integrated text and geodata study was developed because a printed text of the Kakamega-Nandi forests use history would never allow for the inclusion of figures which consider all of the ca. 130 geodatasets the study is based on. The tool supports the viewing of the diverse map and image information while reading the scientific text. Besides, a quality diagram provides a detailed but easy-to-grasp judgement of each geodataset. As such the tool not only documents important research results but communicates them in a traceable manner.
© Huth, K., O. Schnabel & G. Schaab
© updated by: Weist, C., D. Heim
|
Customised GIS Tools
|
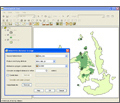
BiotaEastGIS tool
Here, a customised GIS working environment allows so-called non-GIS experts to handle geodata for specific tasks in the field of biodiversity research and consequently for an effective biodiversity management. It covers a number of chained analysis functions as well as functions for simple map creation via an easy-to-use GUI. Besides, the user is guided by a thorough Help System.
(for system/software requirements please read requirements.pdf before downloading tool)
|
|
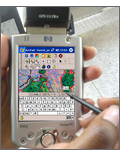
BIOTA-East mobile GIS tools
Forest management and research can be supported by taking geospatial data into the field for orientation and information purposes. Therefore, field-based mobile GIS applications have been addressed for both, the people involved in the forest management as well as the researchers coming to Kakamega. While researchers can thus better target the set-up of their observation plots or transects in the field, forest rangers and guards can make direct use of a database for monitoring and geo-referencing forest disturbances.
© Muchori, F.N., C. Stern & G. Schaab
© updated by: N. Ojha
|
Visualisation Tools
|

|
Dynamic visualisation of agricultural land use scenarios (Kakamega area)
QuickBird imagery of the highly structured farmland surrounding Kakamega Forest was analysed using object-based image analysis and forms the basis of this visualisation tool. In an user-friendly way it allows you to dynamically explore spatial patterns in the agricultural matrix aggregated for 42 ha-sized hexagons. Seven different topics for eight different scenarios modelling the development of crop yields and prices in the years 2005, 2010, 2015 and 2020 as well as various farmland types enable a detailed examination of rural livelihood and can support local planning.
© Klein, J., T. Lübker & G. Schaab
|

|
BIOTA-East multimedia presentation
The multimedia presentation on the BIOTA-East aims at attracting attention by informing via playful means and in an entertaining manner. The navigation specifies different sections to be visited by adults and children. While the adults can learn about the many subprojects, children can enjoy the 'Xtras' including a game on guessing noises from East African rainforests. To both user groups a geodata section is provided. In particular efforts have been put into the diversity of interaction types and effects, consistent user guidance as well as appealing graphics. The multimedia presentation has shown to be useful in environmental education, but is intended to raise interest in biodiversity research.
It has been awarded Third Place for "Best Multimedia Map" at the ESRI International User Conference 2009 in San Diego (USA).
© Zimmer, H., M. Danzeglocke & G. Schaab (German version)
© updated by: Huth, K., N. Mitchell & N. Ojha (English version)
|

|
GIS-applications linking photographs and satellite imagery
GIS-applications linking amateur photographs and satellite imagery aim at combining familiar views (photos taken during a flight across the forest) with more exotic ones (a Landsat satellite image of the forest). Clicking on hotlinks placed along the flight path allows selecting photographs whose extent is marked on the satellite image and thus permits a direct comparison while the application as a whole offers the often missing overview for the people working on the ground.
© Dammann, P., M. Danzeglocke & G. Schaab
© updated by: T. Lung
|
|
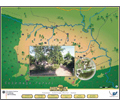
Interactive village maps (Buyangu / Shiamiloli village)
For deriving interactive village maps use was made of the community-based mapping results with very high resolution satellite imagery employed for correctly placing the features. Via a focal mask two information layers can be viewed at a time, e.g. the abstract map and a close-to-reality depiction, i.e. the satellite image. Incorporated photographs (Buyangu) or film clips (Shiamiloli) are intended to help overcome the discrepancy between normal perception and the view from above.
© Dammann, P., M. Danzeglocke & G. Schaab
© updated by: N. Ojha
|
|
Virtual flight over Kakamega and Nandi Forests
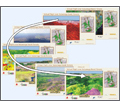
Our virtual flight follows the same idea as with the GIS-application linking photographs and satellite imagery (see above), however, here the photographs have been 'distorted' in such a way that when fading in they match the virtual scenery as created by draping satellite imagery over a digital elevation model. The comparison effect is exaggerated by displaying the satellite image as a false colour composite or showing derived land cover classes. The main motivation for the interactively manoeuvrable virtual flight has been to inform on the forest state.
|

|
Historical narratives
Historical narratives are considered to have good potential in environmental education by stimulating local pride via memory evocation. One narrative employs our land cover change time series of the Kakamega-Nandi forests over the last almost 100 years and allows e.g. a district development officer to generate animations for a particular area of forest to underpin a story of forest change in the area. The other narrative relates to the particular village of Buyangu and is based on specific information from disparate sources and a story compiled by N. Mitchell.
© Asser, B., T. Lung & G. Schaab
|
|
|
Karlsruhe, 28/03/2014


