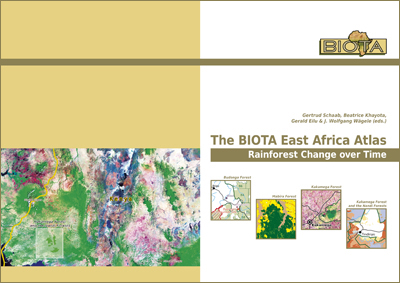
The BIOTA East Africa Atlas. Rainforest Change over Time
Three rainforests. Two countries. One atlas.
| 100 pages. |
 |
| 84 maps. |
| 47 photos. |
| 18 graphs. |
| 12 tables. |
| Useful in Education, Decision making, and Research. |
| Joint Kenyan–Ugandan–German effort. |
| © Schaab, G., B. Khayota, G. Eilu & J.W. Wägele (2010) |
| Presenting BIOTA East Africa research results. |
| In the course of the BIOTA East Africa project a vast amount of geodata was generated for the three investigated rainforest areas. Towards the project's end the wish arose to combine all spatially presentable research results in one representative volume – a cartographic atlas. This atlas is intended to provide an overview of the investigated rainforest areas, to give insight into research results and their causal relations, to tackle many of the examined subject areas, and to enable conclusions for actions, thus meeting the BIOTA East project goals. |
 |
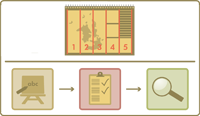
| Addressing different users. |
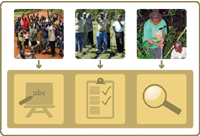 |
The atlas addresses three user groups: the local people next to the forests (requiring easy-to-comprehend information), decision makers (being to draw conclusions from the contents), and scientists (expecting a high level of detail and thematic depth). Consequently the atlas is subdivided into three sections, Education, Decision making, and Research, each of which is tailored to the different needs and abilities of its user group. However, the users are by no means restricted to their specific section.
|
| Covering a broad range of topics. |
| The contents of the atlas are assigned to six main topics and thus draw a line from general overview aspects via population, forest cover change, and forest fragmentation and disturbance, to fauna and flora as well as livelihood. Depending on its level of complexity a certain topic can be mainly found in one section or in all three. |
 |
| Offering a well-considered format. |
 |
A printed publication has been preferred to a digital one as it is a time-honoured format and due to the continuing difficulty in deploying digital media in Africa. Since the atlas should be easy-to-handle the A4 landscape format has been chosen with a wire-O-binding along its longer side.
|
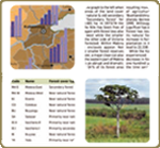
| Featuring various content elements. |
| The contents of the atlas should enable quick and easy acquisition of information for both casual reading and detailed study. Therefore, five basic content elements are used: maps, textual explanations, graphs, tables, and photographs. The three sections Education, Decision making, and Research follow each other in the atlas and thus create an increasing level of complexity. The accompanying texts are written in distinct styles to draw the reader’s attention in different ways. |
 |
| Enabling comparison. |
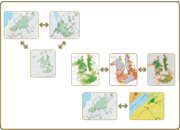 |
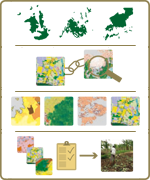
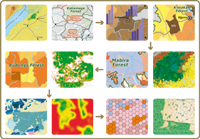
Maps can be found for all the three investigated forest areas. For demonstrating their spatial context a few maps cover an according region of East Africa, or Kenya or Uganda. Due to the differing degrees of research performed not every topic can be displayed for all three forest areas. Opportunities for comparison are nevertheless provided in many instances, both between the forests and by applying varying visualisation methods.
|
| Guiding the reader. |
| To achieve a congruent overall design a five-column page layout was chosen with generally three columns for the maps and two columns for other content elements. In order to guide the reader visually, a colour code is assigned to each of the three sections. |
 |
| Serving different purposes. |
 |
Once distributed in Kenya and Uganda this regional thematic atlas on Rainforest Change over Time may contribute information needed in environmental education, serve as a decision guide for sustainable forest management, provide valuable information to scientists on the transformation of forests over the last century, and serve as a momento for all BIOTA East Africa project members. |
Karlsruhe, 27/03/2015